
We start by understanding your data needs and decision-making process. From there, we design a dashboard that delivers insights in the clearest way possible, ensuring it’s intuitive and aligned with your organization’s goals.

Keep up with dynamic insights that refresh as new data comes in Data-Driven Dashboard
Interactive charts and graphs tailored to your specific needs.
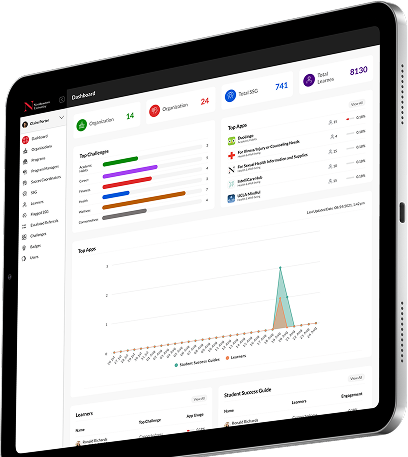
Connects effortlessly with your existing data sources and systems.


Clear, well-structured policy briefs turn complex data into practical strategies. Our approach ensures that every report is tailored to support decision-making, influence policy, and drive real impact.
We work closely with organizations to define key challenges, objectives, and stakeholders.
Relevant data is collected, analyzed, and refined to extract meaningful findings.
Information is organized into a clear, concise, and easy-to-digest format, ensuring accessibility.
Charts, infographics, and visuals enhance clarity, making the findings more compelling.
Each brief undergoes thorough review and refinement to ensure accuracy, clarity, and actionability.
We use cookies to improve your experience, remember preferences, and analyze performance. Denying won't affect your access — only essential cookies will be used. For details, see our Cookie Policy or email info@africaqs.com.
Learn how DataGoat AI simplifies data analysis with automation and smart insights. Download your free report now and stay updated with future innovations!